Know what is happening.
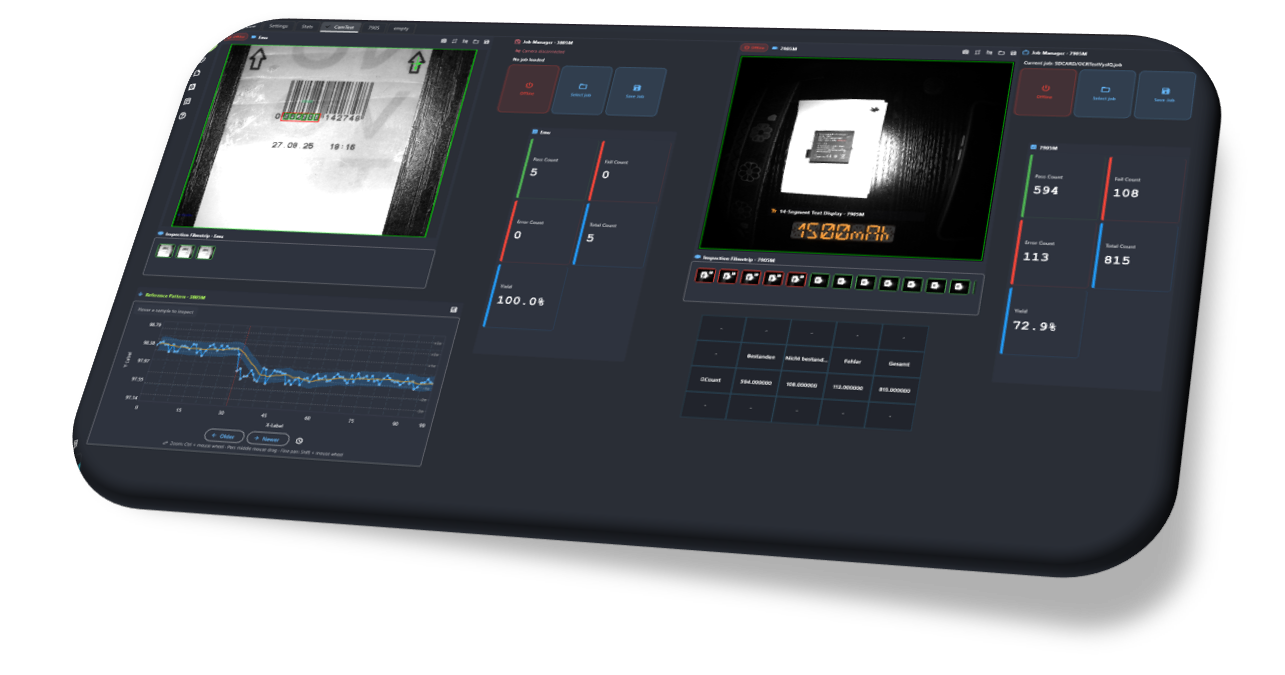
Camera images, measurements and rolling yield. A clear live view for the people running your line.
Live dashboards ↗
Vision Intelligence for Manufacturing
Your cameras inspect. VysIQ gives you the bigger picture.
Live dashboards, inspection history and automated reports for Cognex In-Sight. From the production line to your next quality decision.
FROM INSPECTION TO UNDERSTANDING
A pass or fail is only the beginning. Bring live results, individual parts and long-term trends into one shared view.
Camera images, measurements and rolling yield. A clear live view for the people running your line.
Live dashboards ↗Go back to the part, its image and its measured values. Filter by camera, lot, shift or failure.
Inspection history ↗Compare shifts and lots, identify recurring causes and deliver reports to the people who need them.
Reports & insight ↗YOUR LINE. YOUR LIVE VIEW.
Give operators the detail they need, without losing sight of the line.
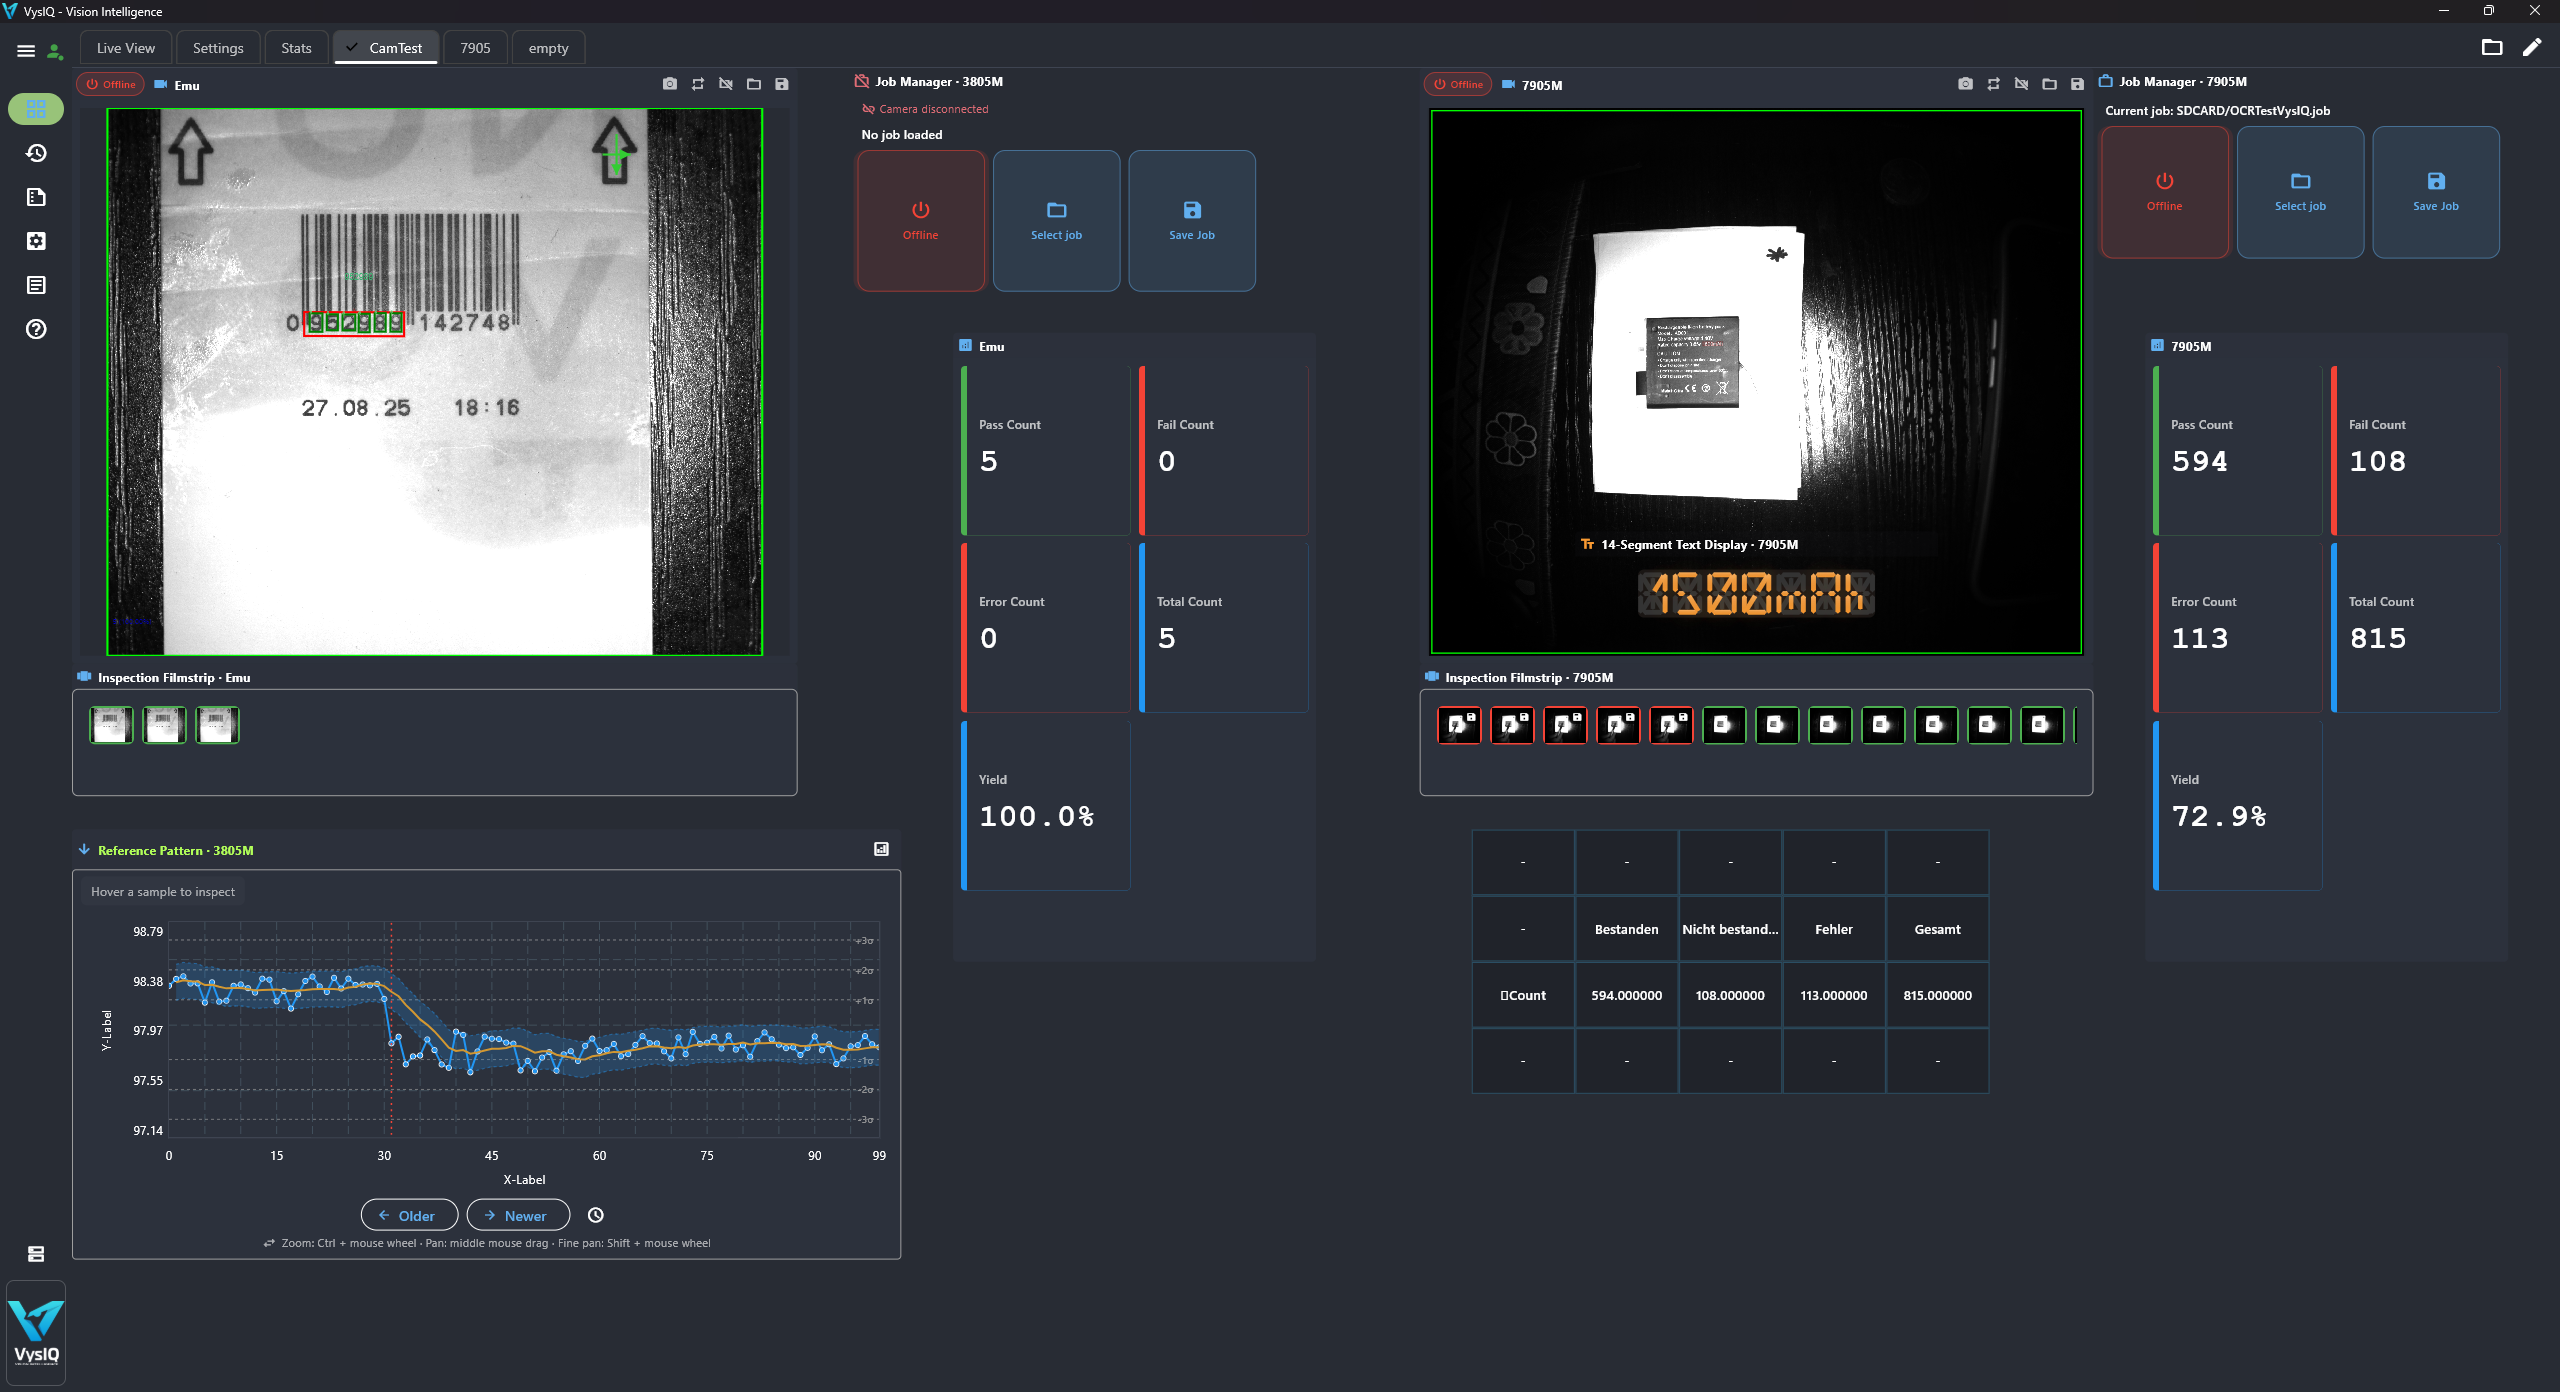
Build layouts for a machine, team or shift with 24 widget types. Combine live camera images, filmstrips, gauges, yield and charts in one workspace.
SEE THE PRODUCT IN ACTION
Take a look inside the VysIQ workspace.
The full product walkthrough, without audio.
QUALITY, WITH CONTEXT
The image. The measurement. The moment.
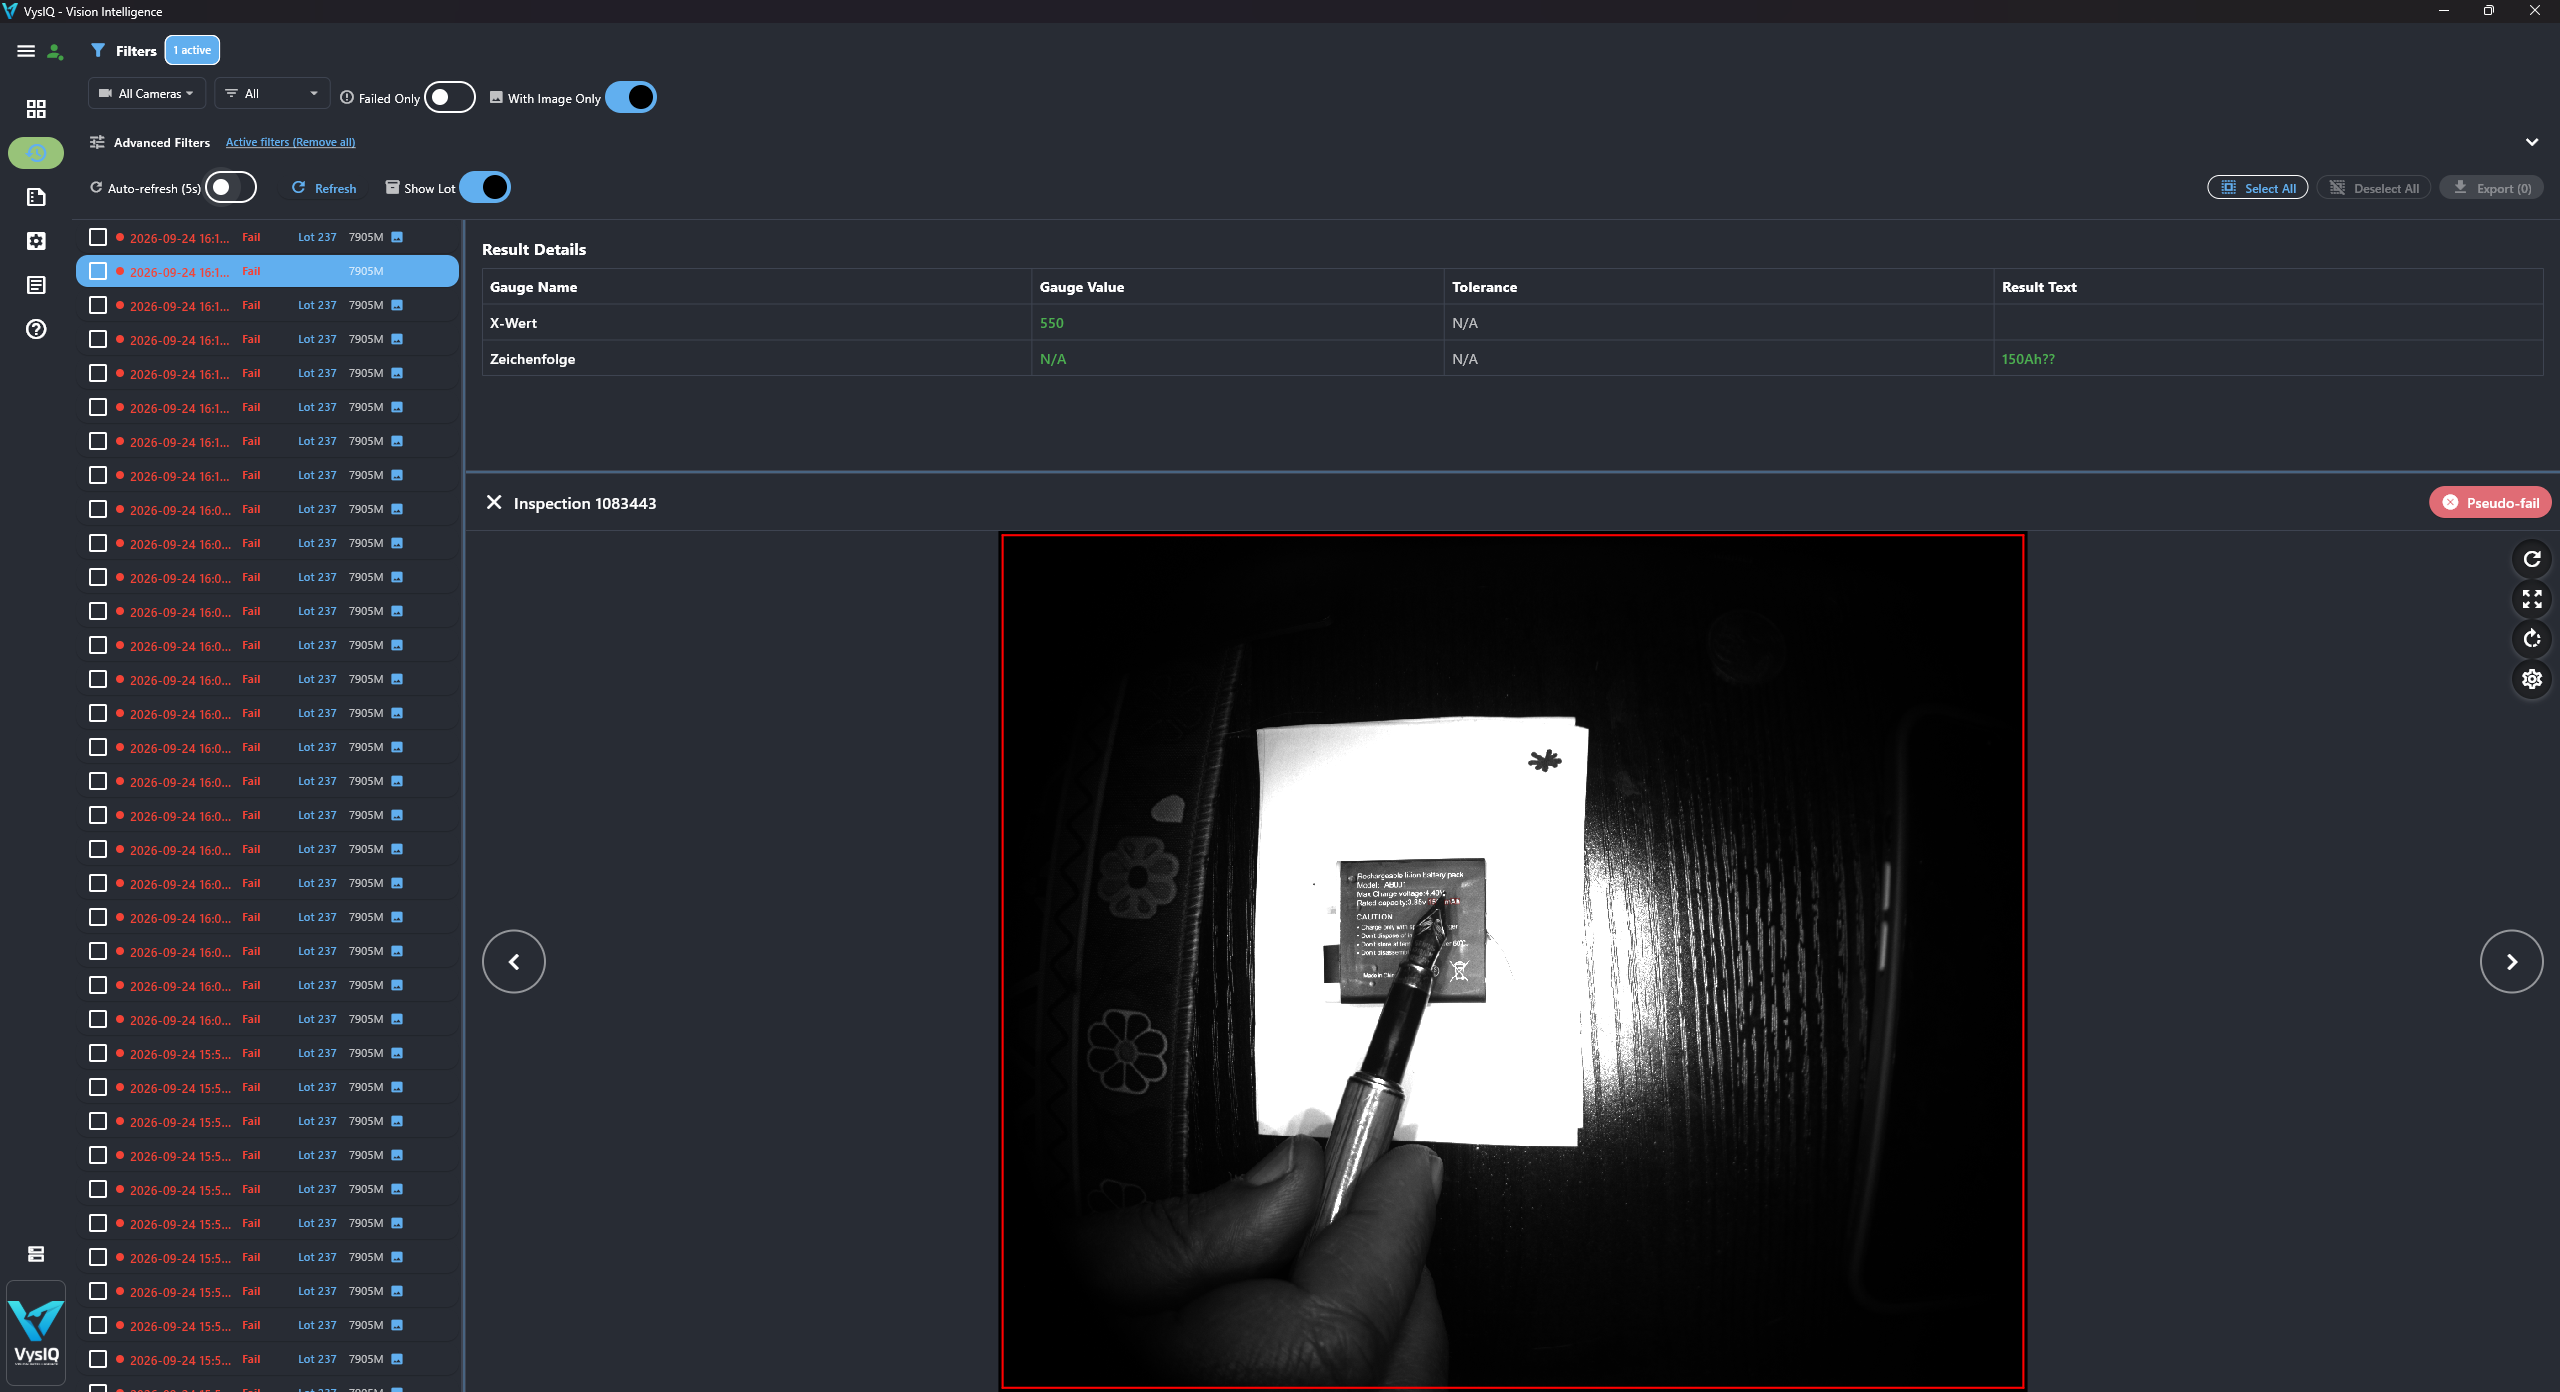
Trace inspection results back to their context. Use Pareto charts to spot recurring failure causes, trends to follow measurement changes and scatter plots to compare gauges.
INSIGHT BEYOND THE LINE
Production reports by shift, lot or day. Export to PDF, CSV, Excel or HTML, and schedule delivery to a folder or by email.
Select gauges, define the sequence and export measurement series for your quality workflow.
Configure thresholds and observation windows. Receive email alerts with NOK images and failure context.
AT HOME IN YOUR FACTORY
Run VysIQ on-premises as a Windows service. No cloud requirement.
Viewer, User and Admin roles, with dedicated access to camera and HMI functions.
Local database and image folders, storage cleanup and backups through your IT processes.
Define the cameras, the production question and the dashboard your team needs first.
ONE PRODUCT. SHARED UNDERSTANDING.
A clear live view and the right controls.
Images, measurements and traceable results.
Yield, shifts and lots in context.
On-premises deployment and access control.
LET'S LOOK AT YOUR PRODUCTION
Show us your inspection setup. We'll explore the right starting point together.